Star Micronics ANNUAL REPORT 2021
Highlights
Star Micronics Co., Ltd. and Consolidated Subsidiaries
For the years ended December 2019, 2020 and 2021
| Millions of yen | Change (%) |
Thousands of U.S. dollars |
|||
|---|---|---|---|---|---|
| 2019 | 2020 | 2021 | 2021/2020 | 2021 | |
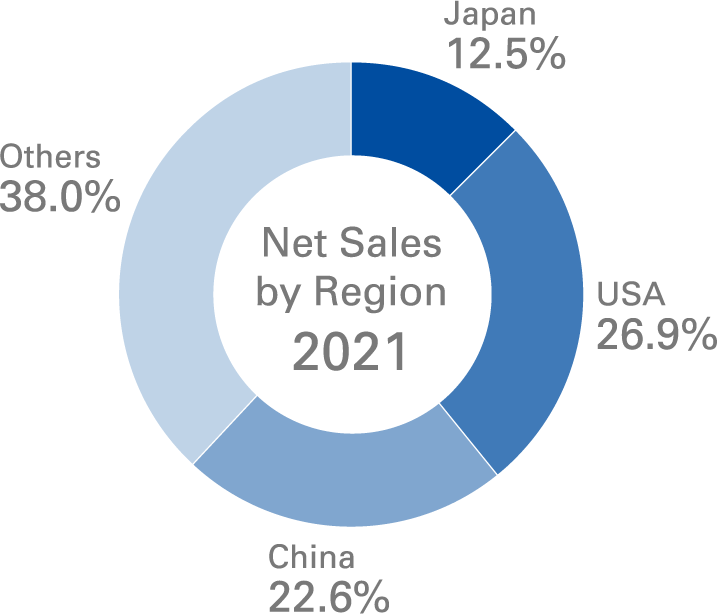
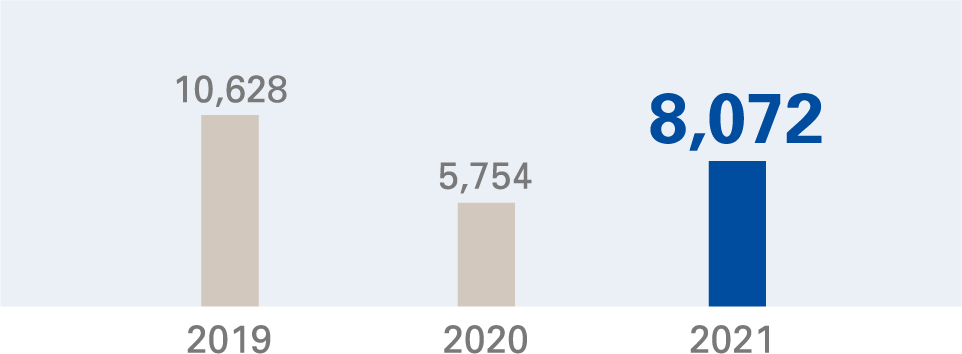
| Japan | ¥10,628 | ¥5,754 | ¥8,072 | 40.3 | $70,191 |
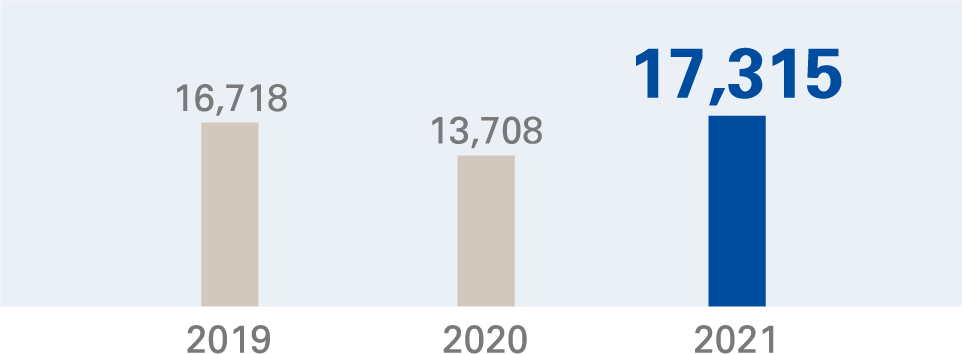
| USA | 16,718 | 13,708 | 17,315 | 26.3 | 150,565 |
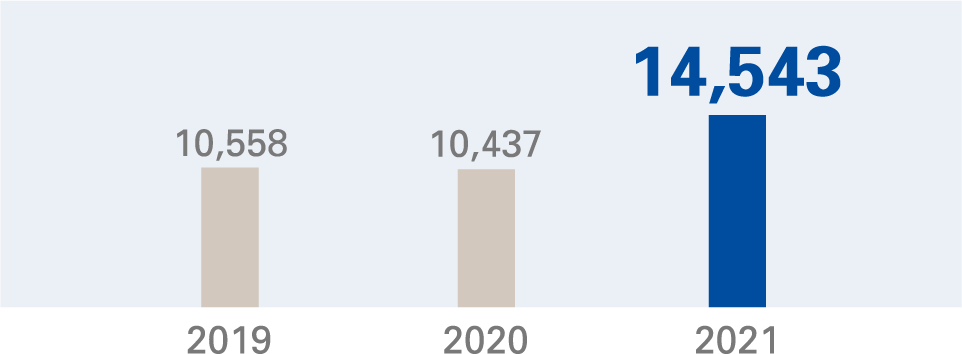
| China | 10,558 | 10,437 | 14,543 | 39.3 | 126,461 |
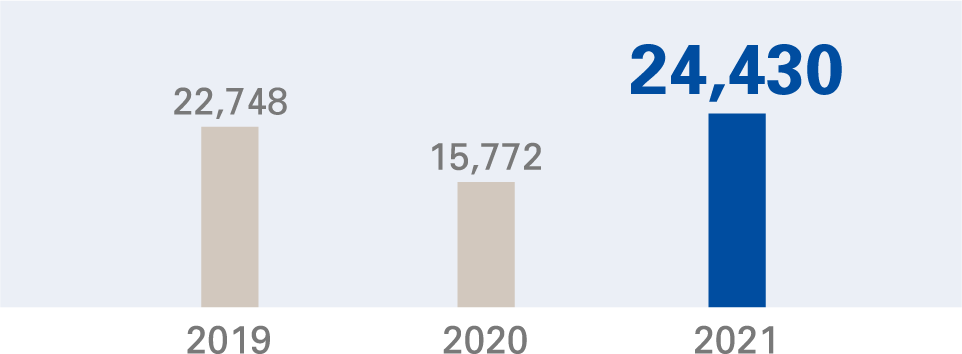
| Others | 22,748 | 15,772 | 24,430 | 54.9 | 212,435 |
| Total | 60,652 | 45,671 | 64,360 | 40.9 | 559,652 |
Note :The rate of ¥115 to US$1, prevailing on December 31, 2021, has been used for translation into U.S. dollar amounts.
Japan(Millions of yen)
USA(Millions of yen)
China(Millions of yen)
Others(Millions of yen)