Star Micronics ANNUAL REPORT 2021
Highlights
Star Micronics Co., Ltd. and Consolidated Subsidiaries
For the years ended December 2019, 2020 and 2021
| Millions of yen | Change (%) |
Thousands of U.S. dollars |
|||
|---|---|---|---|---|---|
| 2019 | 2020 | 2021 | 2021/2020 | 2021 | |
| For the year : | |||||
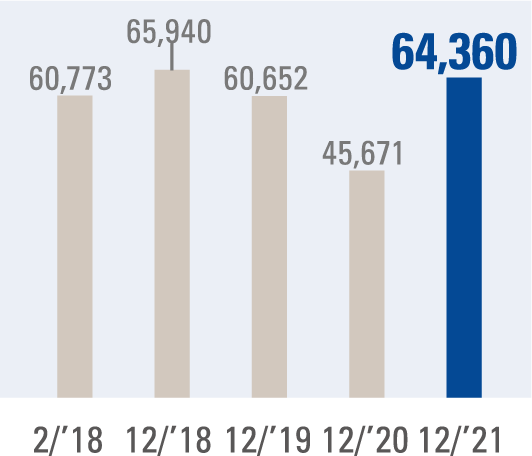
| Net sales | ¥60,652 | ¥45,671 | ¥64,360 | 40.9 | $559,652 |
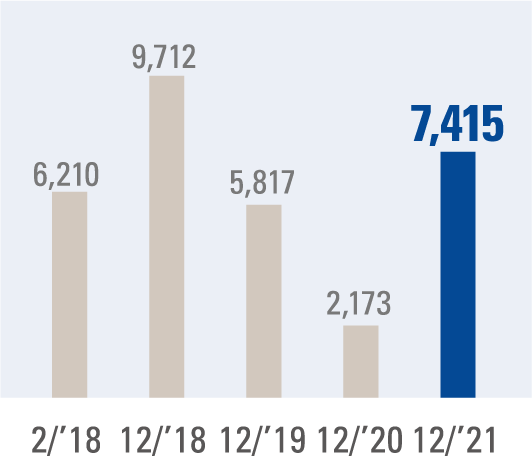
| Operating income | 5,817 | 2,173 | 7,415 | 241.3 | 64,478 |
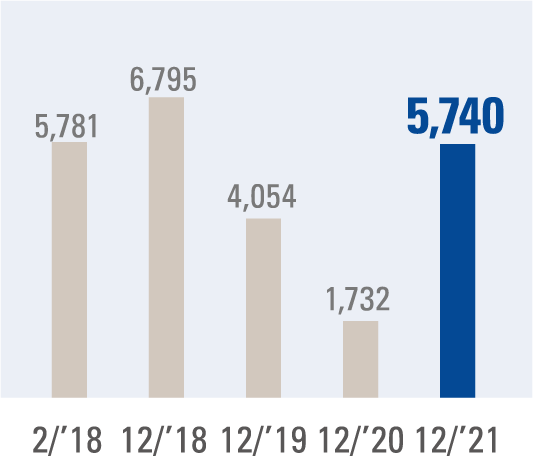
| Net income attributable to owners of the parent |
4,054 | 1,732 | 5,740 | 231.5 | 49,913 |
| Return on sales | 6.7% | 3.8% | 8.9% | ||
| Capital expenditures | 3,067 | 1,908 | 1,926 | 0.9 | 16,748 |
| Depreciation and amortization |
2,419 | 2,255 | 2,127 | -5.7 | 18,496 |
| At year-end : | |||||
| Total assets | 76,394 | 71,622 | 82,361 | 15.0 | 716,183 |
| Total equity | 50,790 | 49,822 | 61,728 | 23.9 | 536,765 |
| Equity ratio | 65.2% | 68.2% | 74.1% | ||
| Yen | Change (%) | U.S. dollars | |||
| Per share : | |||||
| Basic net income | ¥113.72 | ¥49.07 | ¥150.83 | 207.4 | $1.31 |
| Diluted net income | 99.34 | 42.46 | 142.38 | 235.3 | 1.24 |
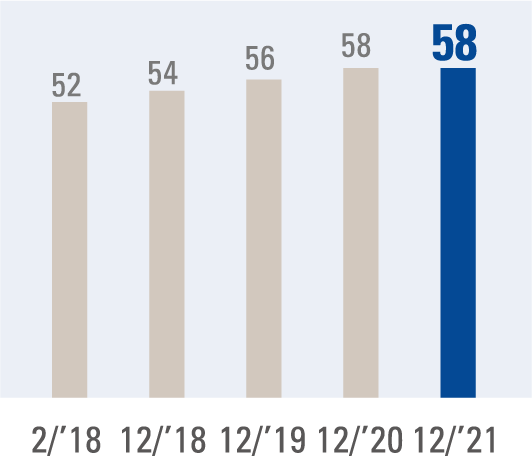
| Cash dividends applicable to the year |
56.00 | 58.00 | 58.00 | - | 0.50 |
| Stock information : | |||||
| Common shares issued | 45,091,334 | 45,091,334 | 44,091,334 | ||
| Number of shareholders | 9,466 | 9,103 | 10,727 | ||
Note :The rate of ¥115 to US$1, prevailing on December 31, 2021, has been used for translation into U.S. dollar amounts.
NET SALES(Millions of yen)
OPERATING INCOME(Millions of yen)
NET INCOME ATTRIBUTABLE
TO OWNERS OF THE PARENT(Millions of yen)
CASH DIVIDENDS APPLICABLE TO THE YEAR(Yen)